96% Carbon-Free Energy

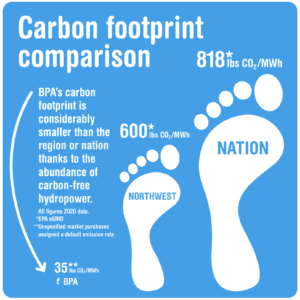
Jefferson county is powered by some of the cleanest most affordable energy in Washington and second-lowest in the country thanks to the Bonneville Power Administration (BPA).
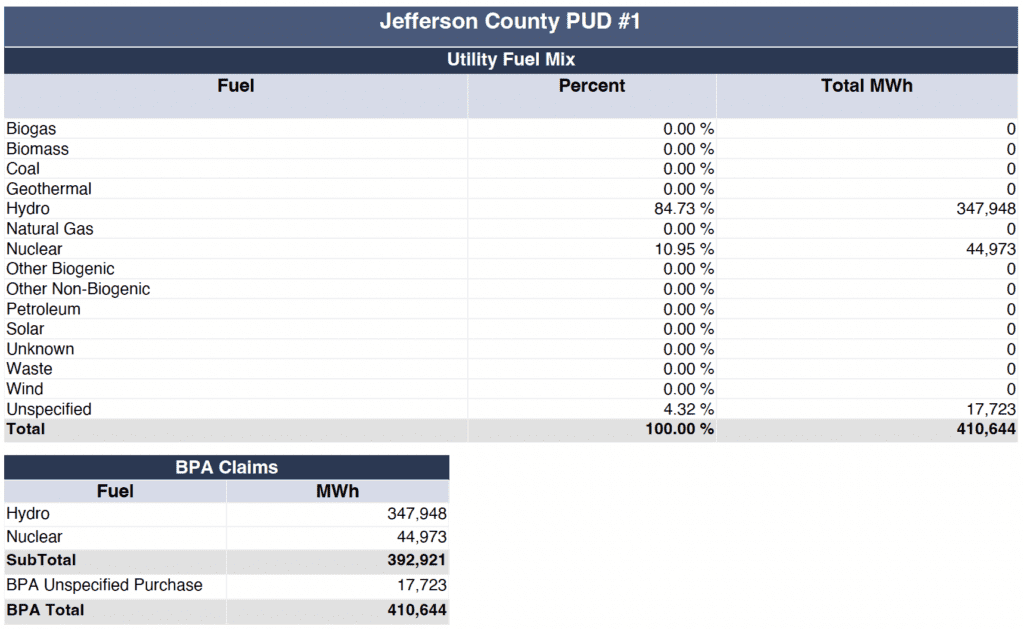
Each year, the WA State Dept of Commerce produces its Electric Utility Fuel Mix Disclosure Report offering a look at the vast world of utility energy sources.
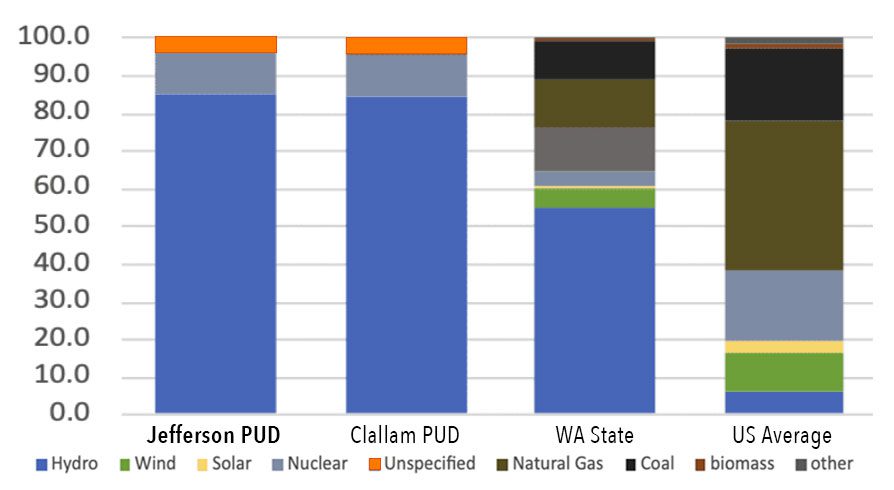
Thanks to BPA, our energy portfolio is an easy one: 84.73% hydropower, 10.95% nuclear, and 4.32% unspecified. Hydro and nuclear power sources are considered non-carbon-emitting. Unspecified sources are power purchases by BPA that may be a mix of wind, solar, and geothermal energy, even coal and natural gas sources, but are not required to report.
Prior to going public in 2013, the largest share of Jefferson County’s electricity came from coal-burning power plants, with more than 60% being generated by fossil fuels.

Nearly 60% of all energy used in Washington comes from hydropower.
Hydropower is renewable energy from rain and snowmelt that doesn’t produce waste or air pollution, saving the equivalent greenhouse gas emissions of more than 10 million cars on the road, according to the BPA.
