SmartHub Dashboard: Usage Graphs
Your SmartHub account dashboard may look a little odd if a lapse in service occurs at your address. Flat sections (as shown in the graphs below) can stem from outage events or a meter relay issue and are accounted for in the PUD’s billing cycle.
SmartHub, our web-based customer portal for billing and utility account management, automatically backfills days when no meter usage was relayed. What does backfilling mean? Backfilled days are the total amount of power usage for a timeframe (in kilowatt hours), divided by the number of days without a read. This generates an averaged number, per day, shown on the dashboard graph.
Important note: All amounts billed are representative of actual power usage at the meter itself.
SmartHub Dashboard: Outages
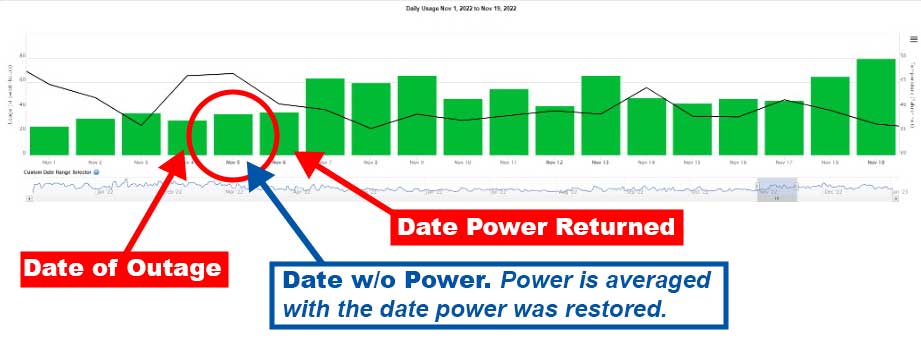
During an outage lasting longer than a day, for example, when the meter itself is not active, your SmartHub dashboard can still show reads. Daily amounts shown during the outage timeframe are averaged from the date the meter was reactivated. The example below had an outage occur on November 4th, with power remaining out through November 5th. Power was restored the morning of November 6th. The meter relayed the read for November 6th, and SmartHub averaged it with the day before.
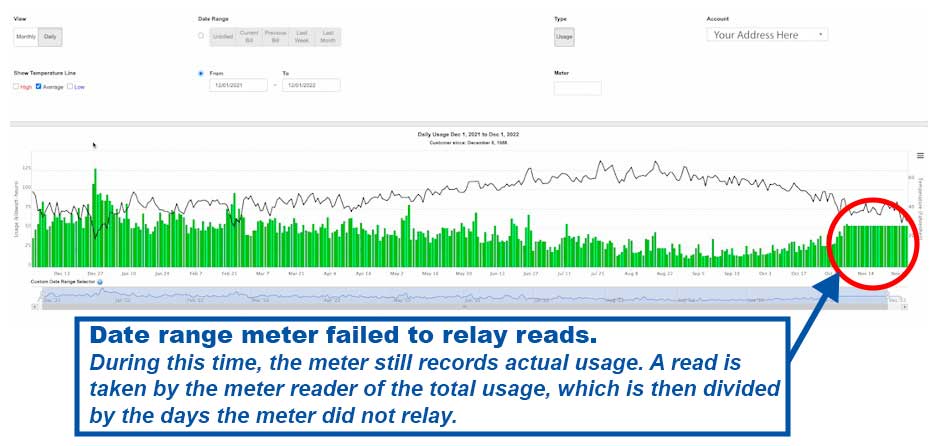
SmartHub Dashboard: Meter Relay Issues
Most electrical meters in Jefferson County are between 20 and 50 years old and all feature a module that was installed by PSE in the 1990’s designed to relay meter reads remotely. Aging relay modules can wear, failing to transmit reads, while the meter itself continues to operate normally.
Failure to relay is represented in circled section of the graph below. The service address still has power, but a manual read by a meter reader is required. PUD meter staff input the meter read for the month into the SmartHub system, which then generates the averaged amount for all the days.
Typically, a meter reader will need to conduct a meter swap, replacing the worn meter with a new transmitting meter. This can lead to a brief interruption in power to the home lasting no longer than 15 minutes.
In each case, outage-related or meter-related, it is important to note the dashboard represents only the actual kilowatt hours used at the service address, be it averaged or a properly functioning daily read.
To learn more and to check your SmartHub dashboard, please click here.