Peak Load: Power Usage Behind the Scenes
Our grid is built to meet peak demand. Peak demand refers to the highest amount of electricity our district uses at any single moment, which often occurs on the coldest of cold mornings.
There is a big difference between the peak demand a utility faces and normal day-to-day usage, making planning for the peak a real challenge!
Power lines, transformers, substations, and other equipment must be sized to safely carry electricity during these periods of intense use. Building to only “typical” demand would lead to potential equipment failure and outages.
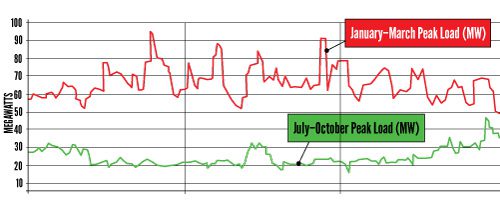
Annual Peak
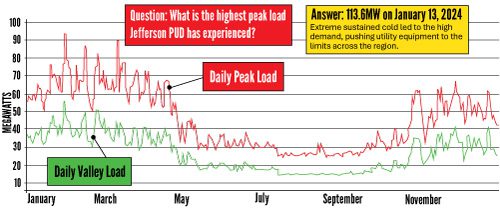
In western Washington, the electric grid experiences its highest demand during the coldest winter days. Extended cold snaps strain equipment and challenge power generators, including BPA, to meet demand across the region. Rapid growth in electrification is increasing concerns about resource adequacy. During widespread cold events, peak demand can exceed available resources, raising the risk of outages.
Daily peaks
The highest points on the chart typically occur in the morning and early evening hours. This represents people waking up, homes heating, coffee pots kicking on (and yes, these are a big energy draw!), breakfasts cooking, and businesses and schools opening. In the evening, demand rises again as people return home. During fair weather conditions, winter days can see an average peak load of 70-80MW, while summer months are relatively calm, peaking around 30MW.
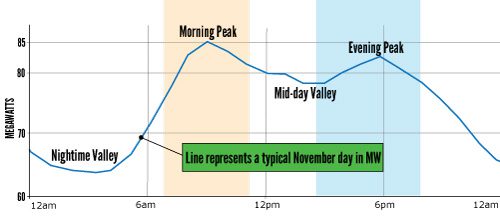
Daily valleys
The lowest points of each line shown is the valley, which usually occur late at night and in the early morning hours, when most people are asleep and businesses are closed. During these times, usage typically drops by approx. 20MW, reflecting only essential loads like refrigeration, water heating, heating systems maintaining temperature, and equipment that runs continuously—which is a collective sigh of relief for equipment.